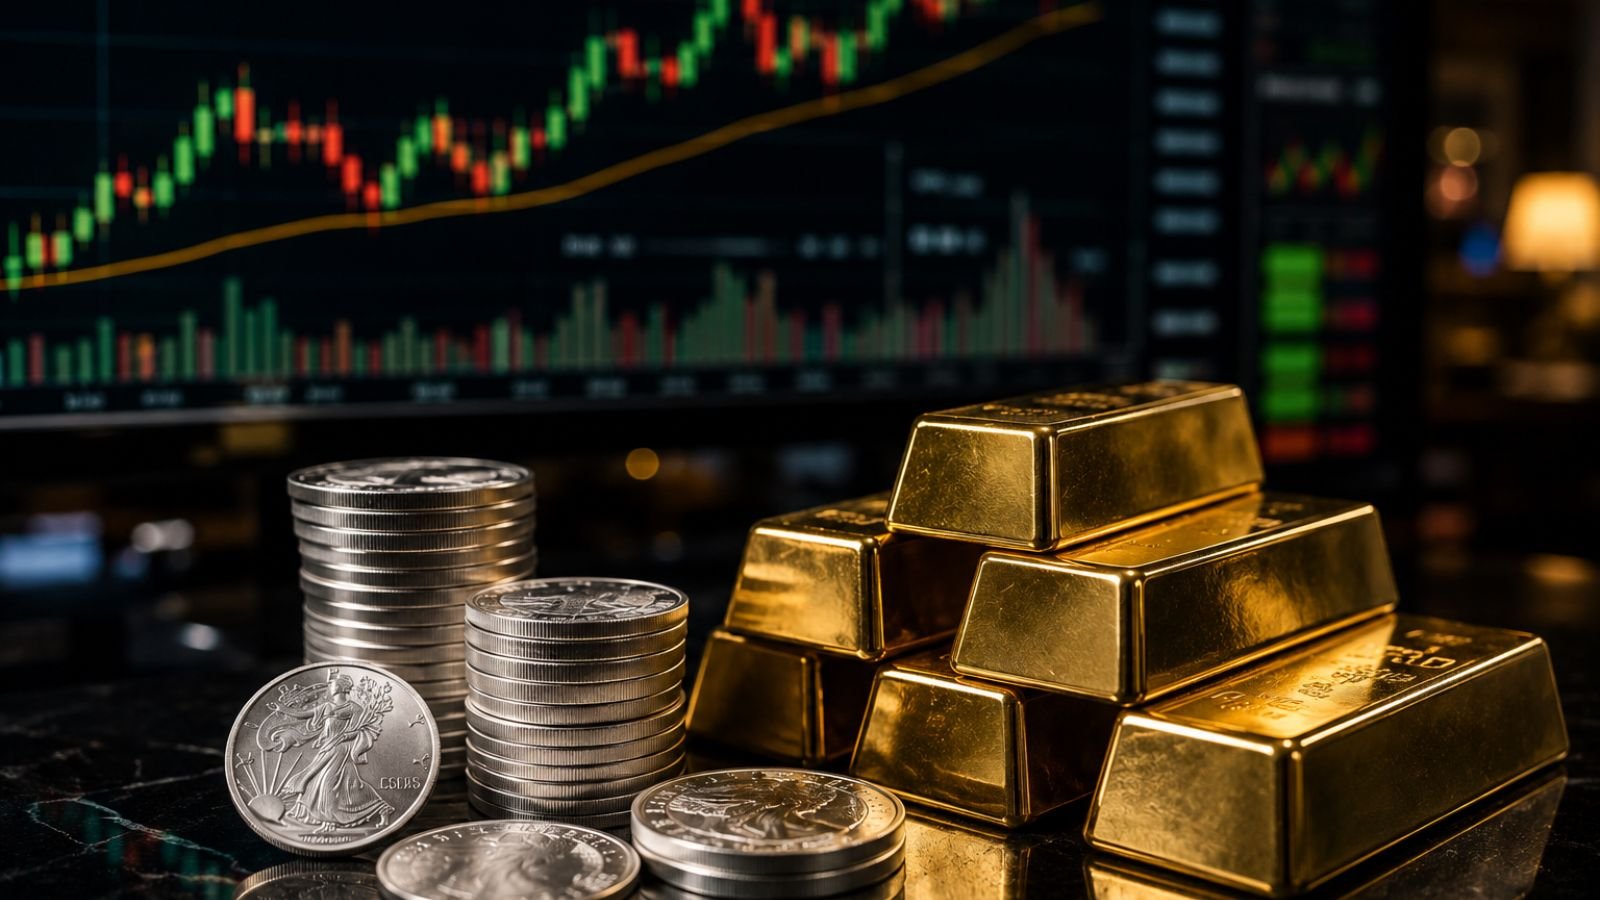
Gold and silver prices traded slightly lower on Friday, May 22, 2026, as global bullion markets remained under pressure due to a stronger US dollar, rising crude oil prices, and cautious investor sentiment linked to geopolitical tensions in West Asia. The weakness in precious metals comes after several weeks of historic rallies during May 2026, when both gold and silver surged to record highs amid safe haven buying and global uncertainty. However, traders are now witnessing a corrective phase as markets closely monitor upcoming US inflation data and possible Federal Reserve policy adjustments. On the Multi Commodity Exchange (MCX), gold futures and silver futures both declined during intraday trading.
Gold and Silver Prices Under Pressure Today
Market sentiment turned cautious on Friday as investors reacted to a stronger US Dollar Index, rising crude oil prices, expectations surrounding future US interest rate decisions, and ongoing geopolitical tensions in West Asia. The stronger dollar reduced immediate demand for bullion assets globally, while rising energy prices added pressure on inflation expectations. As a result, traders reduced aggressive long positions in gold and silver markets. Analysts noted that bullion investors are currently adopting a wait and watch strategy ahead of major US inflation related economic data releases.
MCX Gold and Silver Futures Rates Today
| Metal | Contract | Change | Trading Price | Intraday Low |
|---|---|---|---|---|
| Gold | June 2026 | -0.43% | ₹1,58,927 per 10 grams | ₹1,58,816 |
| Silver | July 2026 | -0.3% | ₹2,74,175 per kilogram | ₹2,73,266 |
The decline reflected consistent profit booking after gold sharp rally earlier this month. Persistent selling pressure and global market caution contributed to the silver decline.
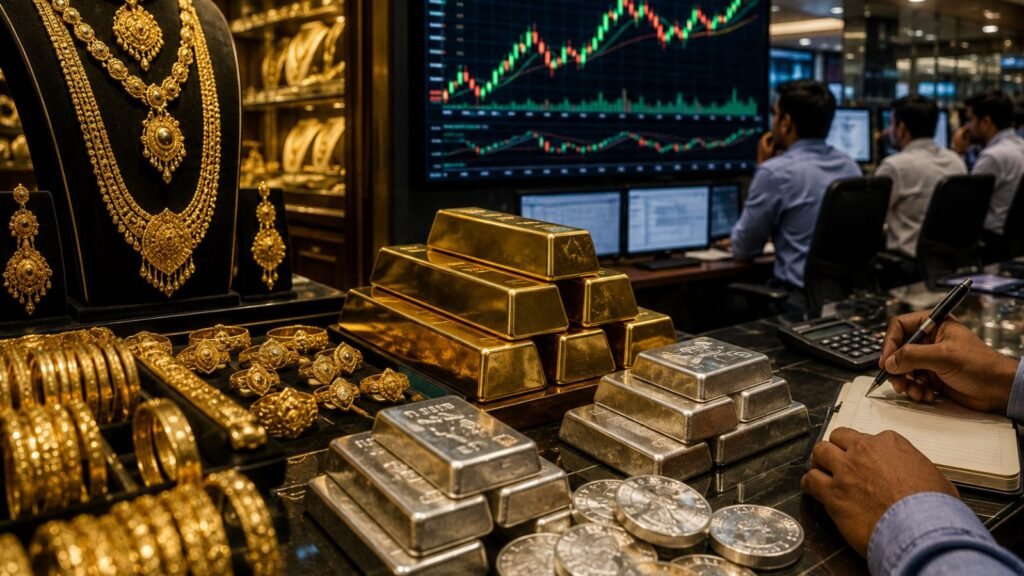
Retail Gold and Silver Rates Across Major Indian Cities
Retail jewelry rates across India also witnessed mild corrections on Friday. Jewelry retailers and bullion sellers adjusted per gram pricing lower compared to the previous trading session.
| City | 24K Gold (per 10g) | 22K Gold (per 10g) | Silver (per kg) |
|---|---|---|---|
| Mumbai | ₹1,59,770 | ₹1,46,456 | ₹2,74,580 |
| New Delhi | ₹1,59,490 | ₹1,46,199 | ₹2,74,100 |
| Bengaluru | ₹1,59,890 | ₹1,46,566 | ₹2,74,790 |
| Kolkata | ₹1,59,500 | ₹1,46,208 | ₹2,74,100 |
Important Note for Buyers
Actual showroom prices may vary because 3 percent GST is added separately, jewelry making charges differ between retailers, and premiums vary by design and location. Consumers planning gold jewelry purchases are advised to confirm final rates directly with retailers before making transactions.
Why Gold and Silver Prices Are Falling Today
Several global and domestic triggers influenced bullion prices on Friday.
- Strong US Dollar Creates Pressure on Bullion: Traders are closely watching University of Michigan inflation expectation data, future Federal Reserve policy signals, and potential changes in US interest rate outlook. A stronger dollar generally makes gold more expensive for international buyers, reducing short term demand
- Rising Crude Oil Prices Increase Market Uncertainty: Crude oil prices moved higher due to geopolitical tensions in West Asia. The increase in oil prices raised inflation concerns, increased uncertainty in global commodity markets, and triggered cautious positioning among investors
- Silver Continues Receiving Industrial Demand Support: Despite the correction, silver prices remain structurally supported by industrial demand. Analysts observed growing consumption from AI data centre infrastructure, solar panel manufacturing, green energy projects, and advanced electronics production
Gold and Silver Witness Historic Rally in May 2026
Although prices corrected slightly today, both metals have experienced extraordinary movement during May 2026. Strong geopolitical tensions and central bank accumulation pushed bullion prices toward record levels earlier this month before entering a consolidation phase.
Gold Price Movement in May 2026
| Parameter | Level |
|---|---|
| May Beginning | ₹1,51,471 per 10 grams |
| Monthly Peak (May 13) | ₹1,63,212 per 10 grams |
| Monthly Floor (May 5) | ₹1,49,351 per 10 grams |
| Current Trading Range | ₹1,58,000 to ₹1,60,000 |
The rally was driven by safe haven accumulation, global uncertainty, supply concerns, and strong investment inflows.
Silver Price Movement in May 2026
| Parameter | Level |
|---|---|
| Monthly Peak (May 19-21) | ₹2,85,000 to ₹2,90,000 range |
| Monthly Floor | Around ₹2,49,000 |
| Current Price | ₹2,74,175 per kilogram |
Silver witnessed even stronger volatility during May with historic technical breakouts, sharp upward momentum, and aggressive speculative activity. The rally was supported by industrial shortages, renewable energy demand, and AI related infrastructure expansion.
Long Term Gold vs Silver Return Comparison
Market analysts highlighted that both gold and silver have delivered strong long term returns over multiple decades.
| Metal | Average May 2026 Price | Historical Baseline | Estimated CAGR | Main Drivers |
|---|---|---|---|---|
| Gold | ₹1,59,000 per 10 grams | ₹63.25 (1964) | 13.2% over 60 years | Currency hedge, central bank buying, safe haven allocation |
| Silver | ₹2,74,000 per kilogram | ₹3,506 (1983) | 10.6% over 43 years | Solar energy demand, AI electronics, green infrastructure |
Market Outlook for Precious Metals
Analysts believe gold and silver may remain volatile in the short term as traders react to US inflation data, Federal Reserve commentary, dollar movement, crude oil fluctuations, and global geopolitical developments. However, structural support for bullion remains strong because central banks continue accumulation trends, global uncertainty remains elevated, and industrial demand for silver continues rising. Investors are expected to closely monitor upcoming global economic events before taking aggressive directional positions.
What Buyers and Investors Should Watch Next
For retail investors and jewelry buyers, the coming sessions could remain highly sensitive to international developments. Important factors to watch include Federal Reserve interest rate expectations, US inflation data releases, dollar index movement, crude oil prices, and geopolitical developments in West Asia. Short term corrections may continue, but long term precious metal demand trends remain active across both investment and industrial markets.
Conclusion
Gold and silver prices traded lower on May 22, 2026, as a stronger US dollar, rising crude oil prices, and cautious investor sentiment weighed on bullion markets. On the MCX, gold futures declined 0.43 percent to ₹1,58,927 per 10 grams, while silver futures slipped 0.3 percent to ₹2,74,175 per kilogram. Retail rates across Mumbai, Delhi, Bengaluru, and Kolkata also witnessed mild corrections. Despite the short term pullback, both metals have delivered extraordinary performance during May 2026, with gold touching ₹1,63,212 and silver testing the ₹2,85,000 to ₹2,90,000 range. Long term structural trends remain supported by central bank accumulation, industrial silver demand from AI and solar sectors, and persistent global uncertainty.
Frequently Asked Questions
Q1. What are the MCX gold futures rates on May 22, 2026?
A1. MCX gold futures for the June 2026 contract traded at ₹1,58,927 per 10 grams, down 0.43 percent, with an intraday low of ₹1,58,816.
Q2. What are the retail gold rates in Mumbai today?
A2. In Mumbai, 24K gold is at ₹1,59,770 per 10 grams, 22K gold at ₹1,46,456 per 10 grams, and silver at ₹2,74,580 per kilogram.
Q3. Why are gold and silver prices falling?
A3. Prices are falling due to a stronger US dollar, rising crude oil prices, cautious investor sentiment ahead of US inflation data, and potential Federal Reserve policy adjustments.
Q4. What was gold highest price in May 2026?
A4. Gold touched a monthly high near ₹1,63,212 per 10 grams on May 13, 2026, driven by safe haven buying and geopolitical tensions.
Q5. What is the long term CAGR for gold and silver?
A5. Gold has delivered approximately 13.2 percent CAGR over 60 years, while silver has delivered approximately 10.6 percent CAGR over 43 years.