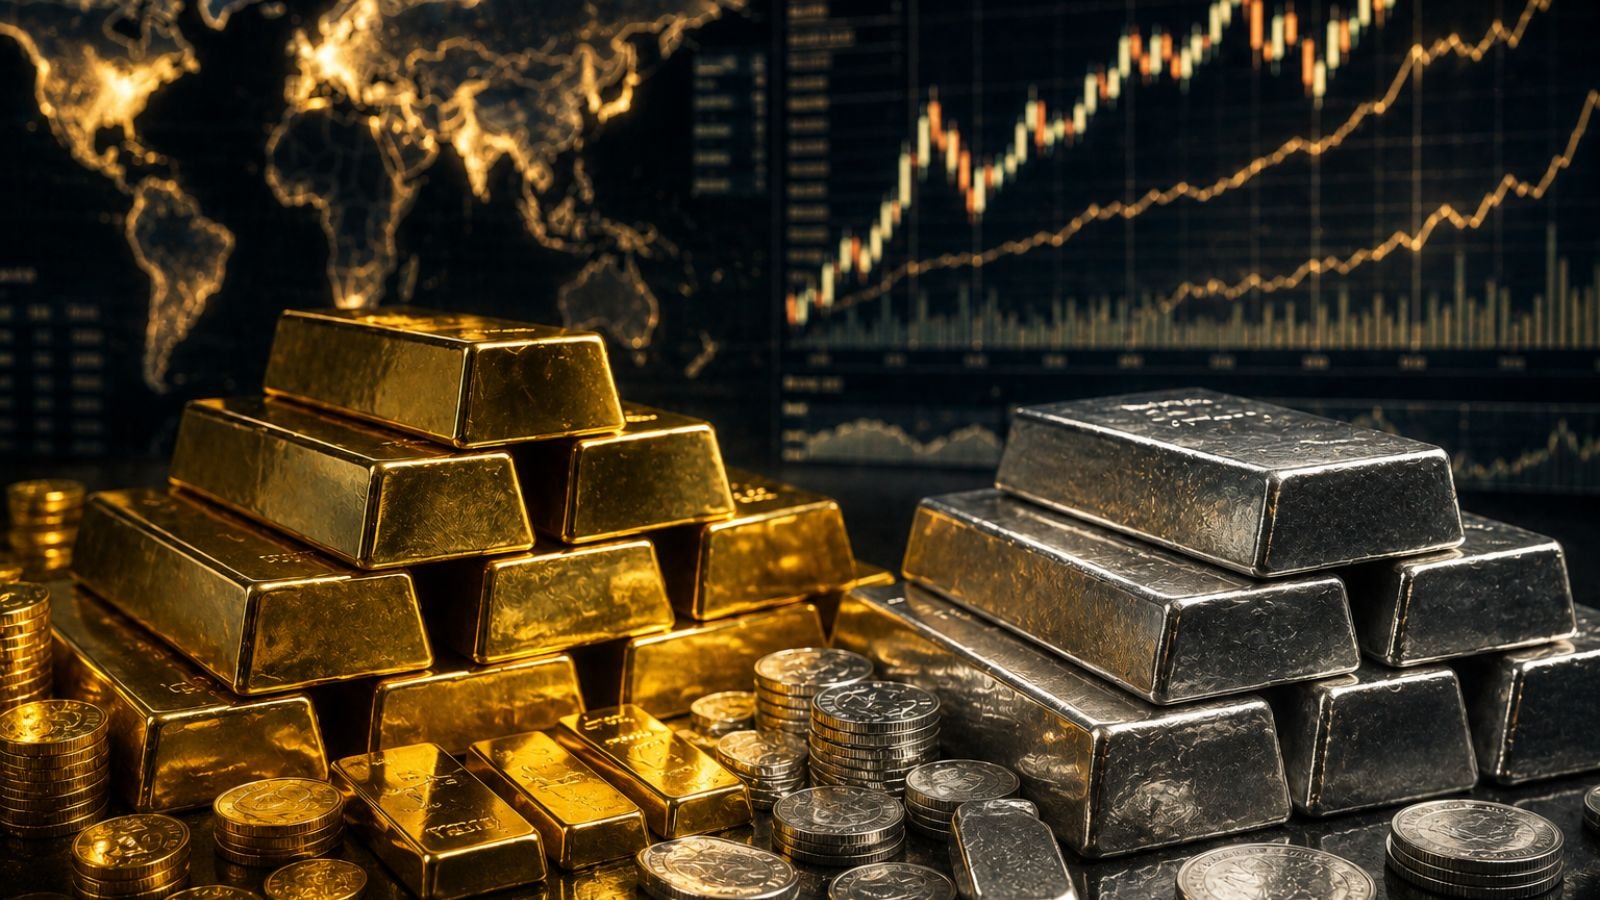
Gold and silver prices in May 2026 have surged near record highs as global market tensions shake stock markets worldwide. Escalating US Iran tensions, rising global inflation, foreign institutional selling, and weakness in the bond market are pushing investors toward precious metals. While stock markets across India and globally remain under pressure, gold and silver continue consolidating near historic highs. Investors are now closely monitoring crude oil prices, US Treasury yields, central bank gold accumulation, and geopolitical developments heading into June 2026.
Why Investors Are Moving Toward Gold and Silver in May 2026
The current market environment reflects growing uncertainty across global financial systems. Several major catalysts are driving this trend:
- Escalating Middle East tensions
- Rising inflation fears
- Bond market weakness
- Aggressive foreign capital outflows
- Weakening confidence in growth focused equities
As a result, investors are rotating funds from high risk technology and growth sectors into defensive assets such as gold and silver. Gold remains in a broader structural bull market. Silver is experiencing volatile consolidation after speculative spikes. Equities are facing cautious to downward pressure globally.
May 2026 Month End Asset Snapshot
Gold Market Performance
- International Gold Price: 4,460 to 4,540 US dollars per ounce
- India MCX Gold Price: Approximately 1,58,900 rupees per 10 grams
- Current Momentum: Short term correction with broader long term bullish structure
- Primary Catalyst: Escalating Middle East war risks and global inflation concerns
Rising US interest rates are limiting gold short term upside momentum.
Silver Market Performance
- International Silver Price: 74 to 80 US dollars per ounce
- India MCX Silver Price: 2,68,000 to 2,75,500 rupees per kilogram
- Current Momentum: High beta consolidation and pullback after speculative rallies
- Key Drivers: Green energy supply deficits, EV and solar panel demand, manufacturing slowdown fears globally
Silver remains heavily tied to industrial demand while also acting as a precious metal hedge.
Global and Indian Stock Market Outlook
Global equities remain under pressure with the following conditions:
- Nifty 50 hovering near 23,600
- S&P 500 and Dow trading weak
- Heavy foreign institutional selling
- Sector rotation out of technology stocks
- Brent crude near 111 US dollars per barrel
- Rising inflation pressure
- High energy costs
- Weakening profit margins
Continued downward pressure is expected on consumer discretionary stocks, banking equities, and technology companies.
Key Indicators Investors Must Watch in June 2026
- 30 Year US Treasury Yield: Yields have reached their highest levels since 2007. Higher yields reduce the attractiveness of zero yield assets like gold because investors can earn stronger returns from bonds.
- Strait of Hormuz and Brent Crude Oil: Brent crude is trading around 111 US dollars per barrel. Shipping disruptions and geopolitical instability surrounding the Strait of Hormuz are directly contributing to sticky inflation, higher transportation costs, and rising energy prices globally.
- Central Bank Gold Accumulation: Global central banks continue accumulating physical gold reserves. This trend is being driven by de dollarization efforts, rising sovereign debt concerns, and demand for safe reserve assets. This aggressive accumulation is helping create a structural support zone for gold prices.
- Gold to Silver Ratio: The current gold to silver ratio is hovering near 63 to 1. Historically this ratio suggests silver may be undervalued relative to gold. Silver could see stronger tactical upside if industrial demand remains stable.
What Investors Need to Be Careful About
Stagflation Trap
- Global growth projections for 2026 have been reduced to 2.5 percent
- Energy costs are rising
- Inflation remains elevated
- Corporate profit margins are shrinking
This combination creates pressure on stock markets while supporting defensive assets like gold.
False Peace Deal Market Reactions
- Markets are reacting violently to geopolitical headlines
- Temporary military pauses are triggering profit booking in gold
- The broader geopolitical structure remains unstable, meaning sharp corrections may become buying opportunities rather than trend reversals
Silver Double Edged Risk
- Sixth consecutive year of physical supply deficits
- Strong demand from EVs, solar panels, and AI data centers
- Silver lacks central bank support enjoyed by gold
- Silver can witness 20 to 30 percent crashes during sudden US dollar rallies
Keeping silver allocations balanced reduces excessive portfolio volatility.
Gold and Silver Prices in India May 2026
Benchmark Indian retail pricing currently stands at 1,58,350 to 1,58,850 rupees per 10 grams for 24 karat gold and 2,70,000 to 3,00,000 rupees per kilogram for silver. Local transportation costs, state taxes, and jeweler associations create slight regional pricing variations.
State Wise Gold and Silver Prices in India
| State / City | 24K Gold (per 10g) | 22K Gold (per 10g) | Silver (per kg) |
|---|---|---|---|
| Maharashtra Mumbai Pune | 1,58,530 | 1,44,250 | 2,80,000 |
| Delhi NCR | 1,58,850 | 1,45,610 | 2,70,380 |
| Gujarat Ahmedabad Surat | 1,52,030 | 1,44,790 | 2,90,000 |
| Karnataka Bengaluru | 1,58,350 | 1,43,950 | 2,80,000 |
| Tamil Nadu Chennai Coimbatore | 1,59,400 | 1,48,700 | 3,00,000 |
| Uttar Pradesh Lucknow Ayodhya | 1,56,930 | 1,43,750 | 2,75,000 |
| Telangana Andhra Pradesh Hyderabad | 1,58,350 | 1,44,000 | 2,99,900 |
| West Bengal Kolkata | 1,58,500 | 1,43,800 | 2,78,000 |
Regional market trends:
- Maharashtra: High trading volume helping keep premium spreads relatively low
- Delhi: Remains one of the strongest retail demand zones for bullion
- Gujarat: Moderate short term correction observed recently
- Karnataka: Technology sector weakness driving retail hedging demand toward metals
- Tamil Nadu: Heavy traditional jewelry demand continues pushing prices higher
- Uttar Pradesh: Wedding season buying remains strong
- Telangana and Andhra Pradesh: Aggressive silver accumulation observed
- West Bengal: Prices remain aligned with broader national MCX averages
Important Checklist for Physical Gold Buyers
- 3 percent GST surcharge on top of listed retail values
- Making charges from 5 percent up to 18 percent depending on machine craftsmanship, handmade design complexity, and purity standards
- Verify IBJA benchmark pricing at exact transaction time
- Check morning or evening benchmark pricing references
- Do not purchase 22K or 18K jewelry without HUID hallmark verification
- Verify the 6 digit Hallmark Unique Identification code
Conclusion
May 2026 has become one of the most volatile periods for global financial markets as investors rotate away from risky equities toward defensive precious metals. Gold and silver continue trading near historic highs amid geopolitical instability, inflation fears, and rising bond yields. Gold remains structurally bullish despite short term corrections, while silver offers high risk high volatility upside tied closely to industrial demand and green energy supply deficits. Indian bullion prices remain elevated across major states including Maharashtra, Delhi, Gujarat, Karnataka, Tamil Nadu, Telangana, Uttar Pradesh, and West Bengal. Investors and retail buyers are now carefully monitoring crude oil prices, US Treasury yields, global inflation trends, and central bank gold accumulation as markets prepare to enter June 2026.
Frequently Asked Questions
Q1. What are gold and silver prices in India in May 2026?
A1. Gold prices range from 1,52,000 to 1,59,400 rupees per 10 grams, while silver prices range from 2,70,000 to 3,00,000 rupees per kilogram across different states.
Q2. Why are gold and silver prices rising in May 2026?
A2. Rising prices are driven by US Iran tensions, global inflation, bond market weakness, foreign institutional selling, and central bank gold accumulation.
Q3. What is the international gold price in May 2026?
A3. International gold price is trading between 4,460 and 4,540 US dollars per ounce.
Q4. What is the gold to silver ratio currently?
A4. The current gold to silver ratio is approximately 63 to 1, suggesting silver may be undervalued relative to gold.
Q5. What should physical gold buyers check before purchasing?
A5. Buyers should verify 3 percent GST, making charges between 5 and 18 percent, IBJA benchmark pricing, and 6 digit HUID hallmark on 22 karat or 18 karat jewelry.